41. Text: Calculated Fields
Text for Previous Video on Calculated Fields
Calculated fields
There will be times when you want to look at something but there isn't a specific field for it. For instance, maybe you want to know the profit per item for each order record. It seems pretty simple, just divide profit by order for each record, then aggregate it, but how do you actually do the division in Tableau?
The answer is calculated fields. Calculated fields let you create new fields to use in your visualizations. If you have experience working with formulas in Excel, creating calculated fields should feel pretty similar.
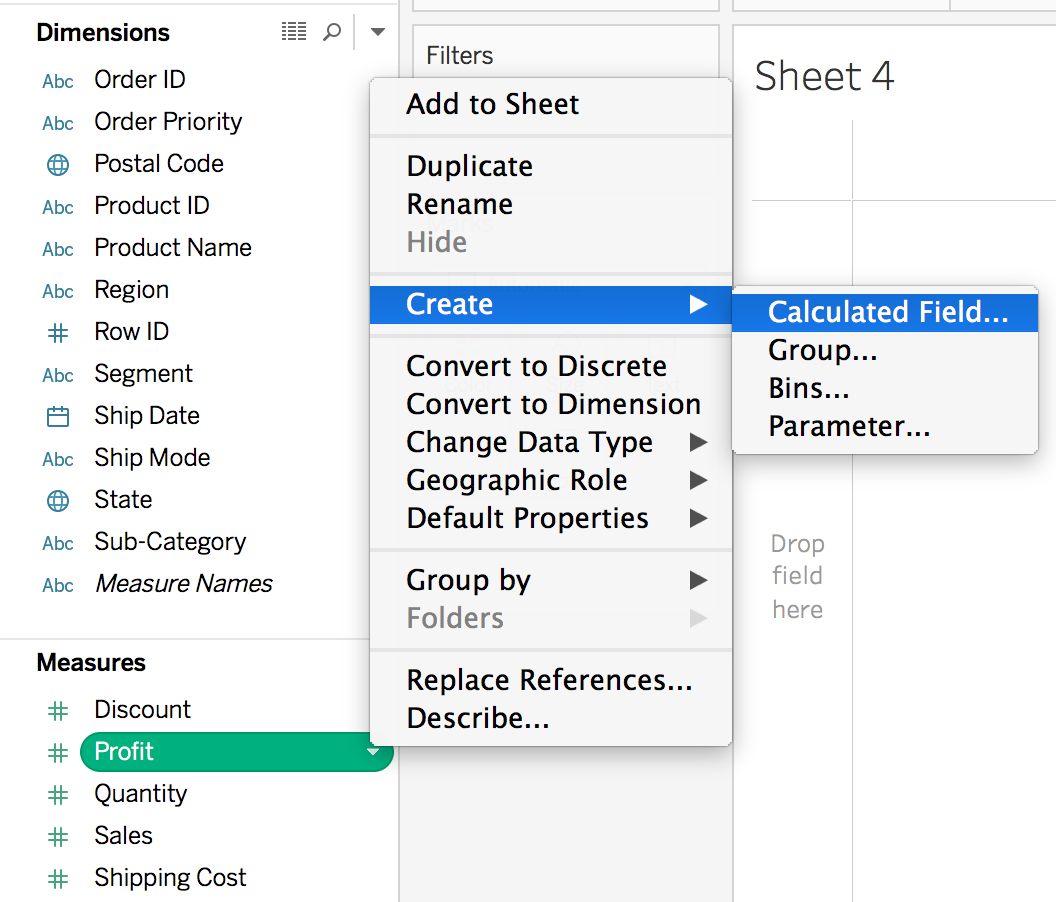
To create a calculated field, open the menu on a field (such as Profit), then Create > Calculated Field…. (See below). You can also create one by clicking on "Analysis" in the top menu bar, then selected "Create Calculated Field…"
You should see the editor:
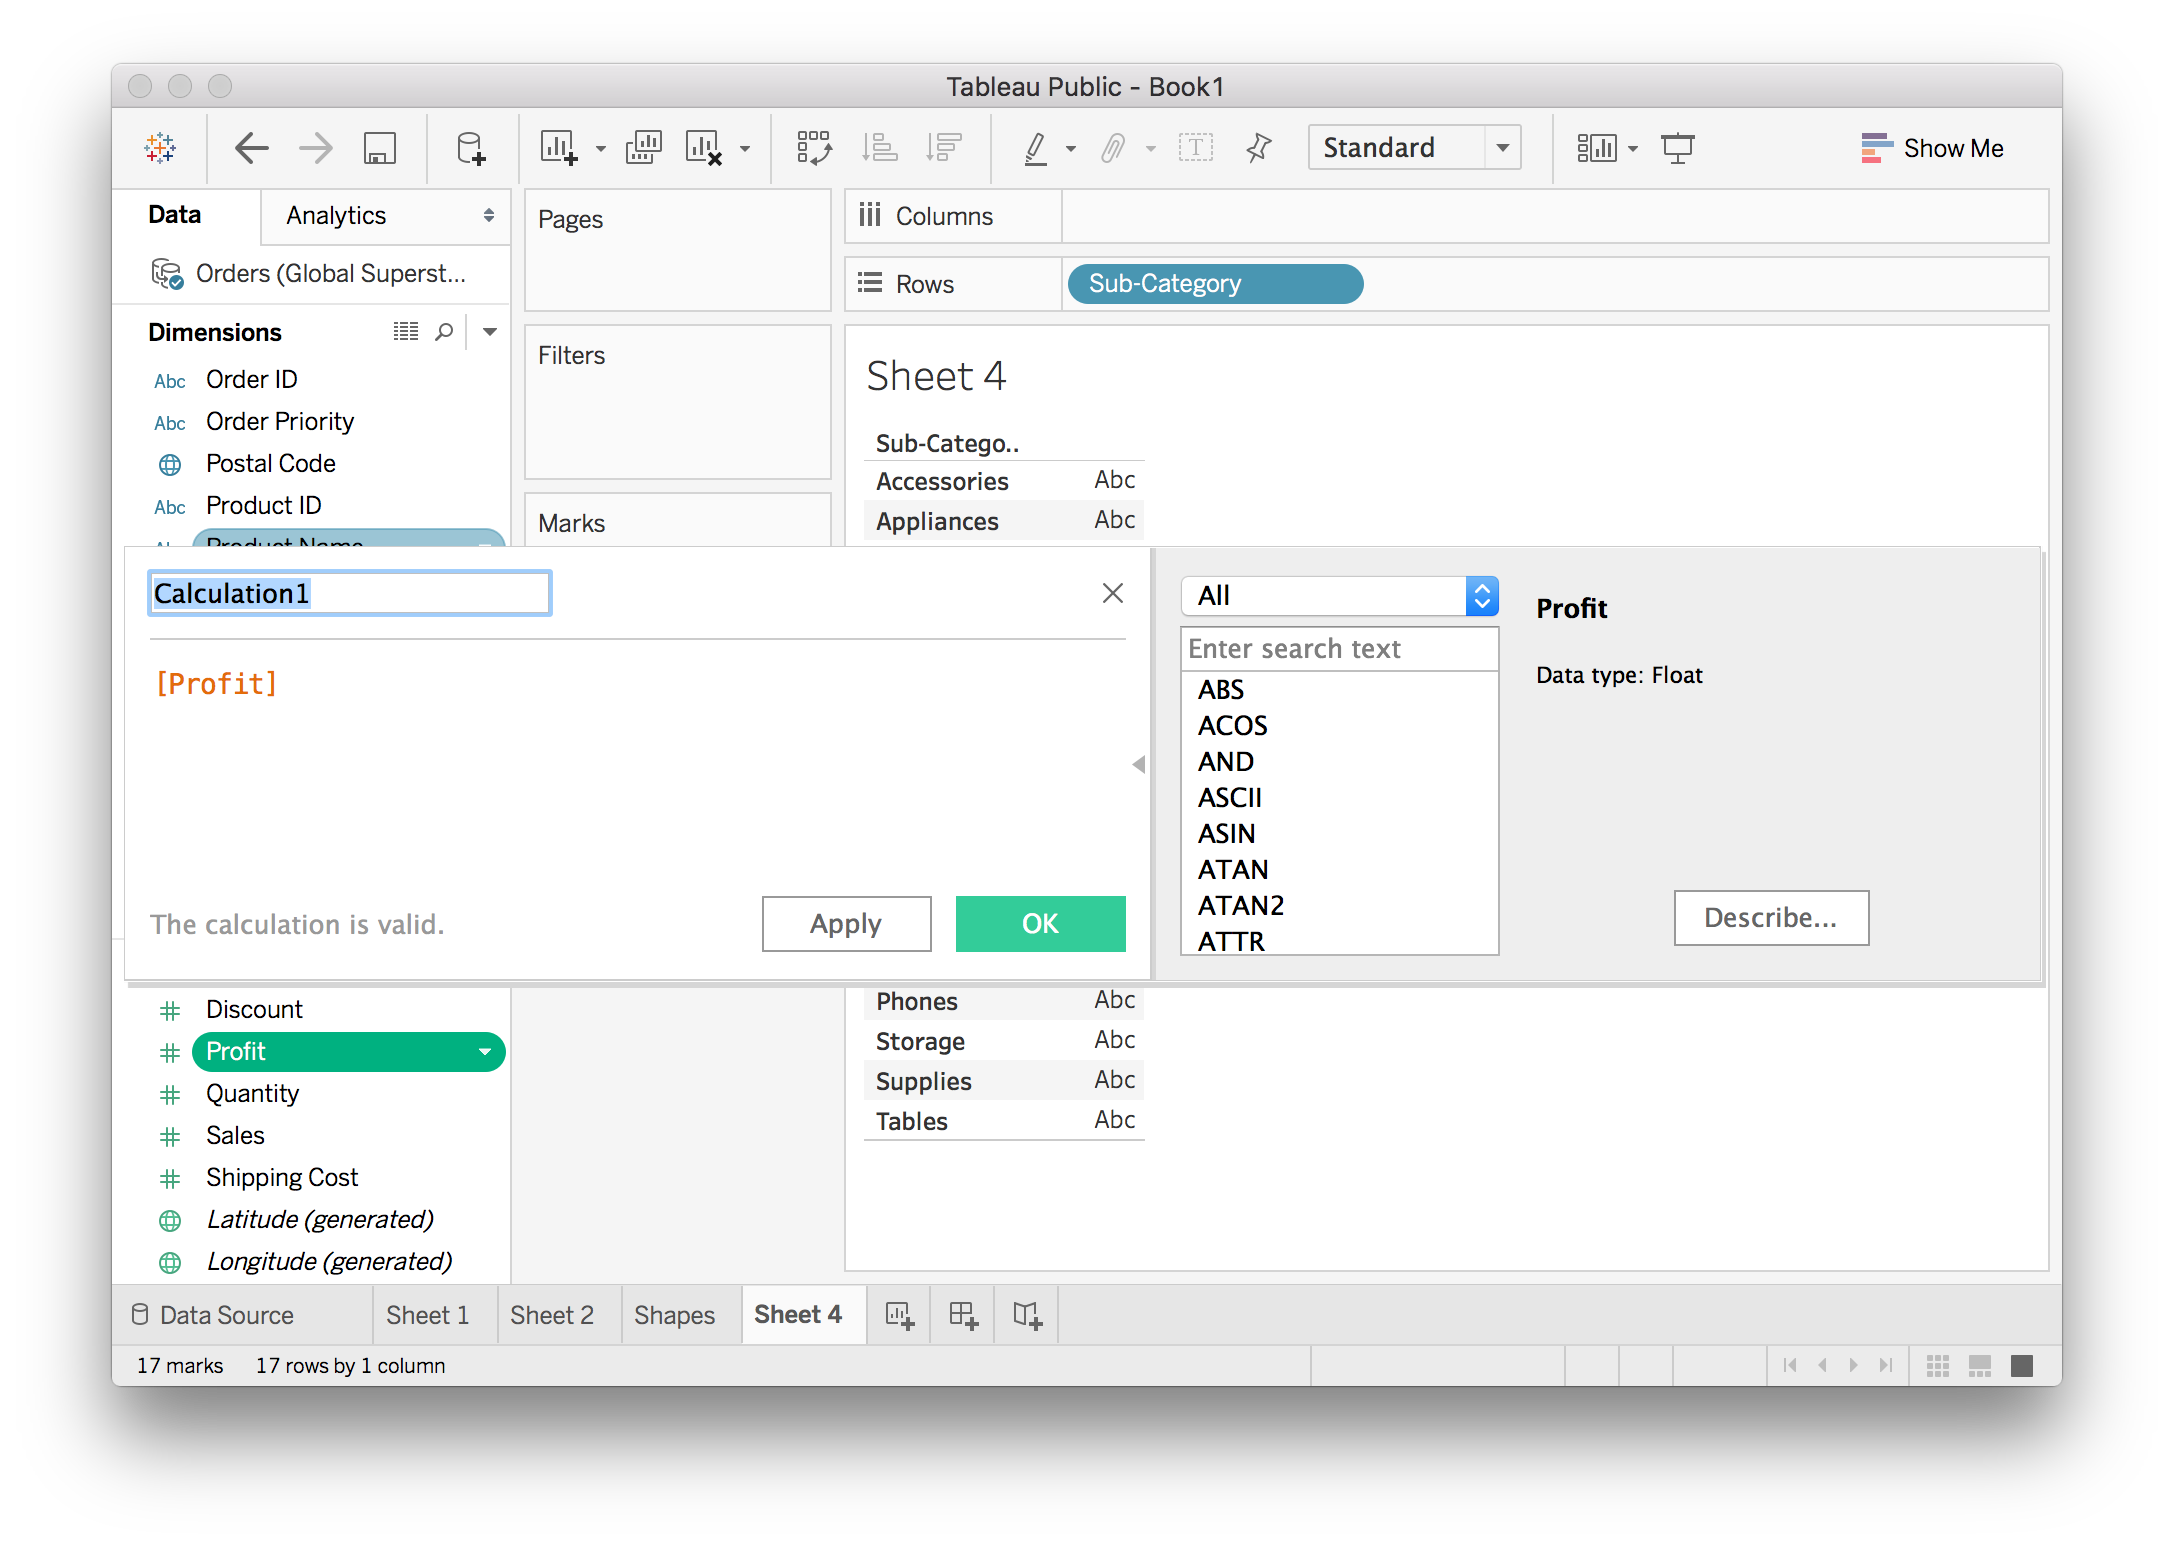
If you don't see the functions panel, click on the little triangle on the right edge of the editor.
Fields in the editor show up in brackets, like [Profit]. You can do simple arithmetic here, like adding a constant, or multiplying the field. You can also use functions such as absolute value, sine, square root, etc. If you want to make a field all positive, you'd do ABS([Profit]). There is a list of functions on the right and some short documentation is shown when you select one.
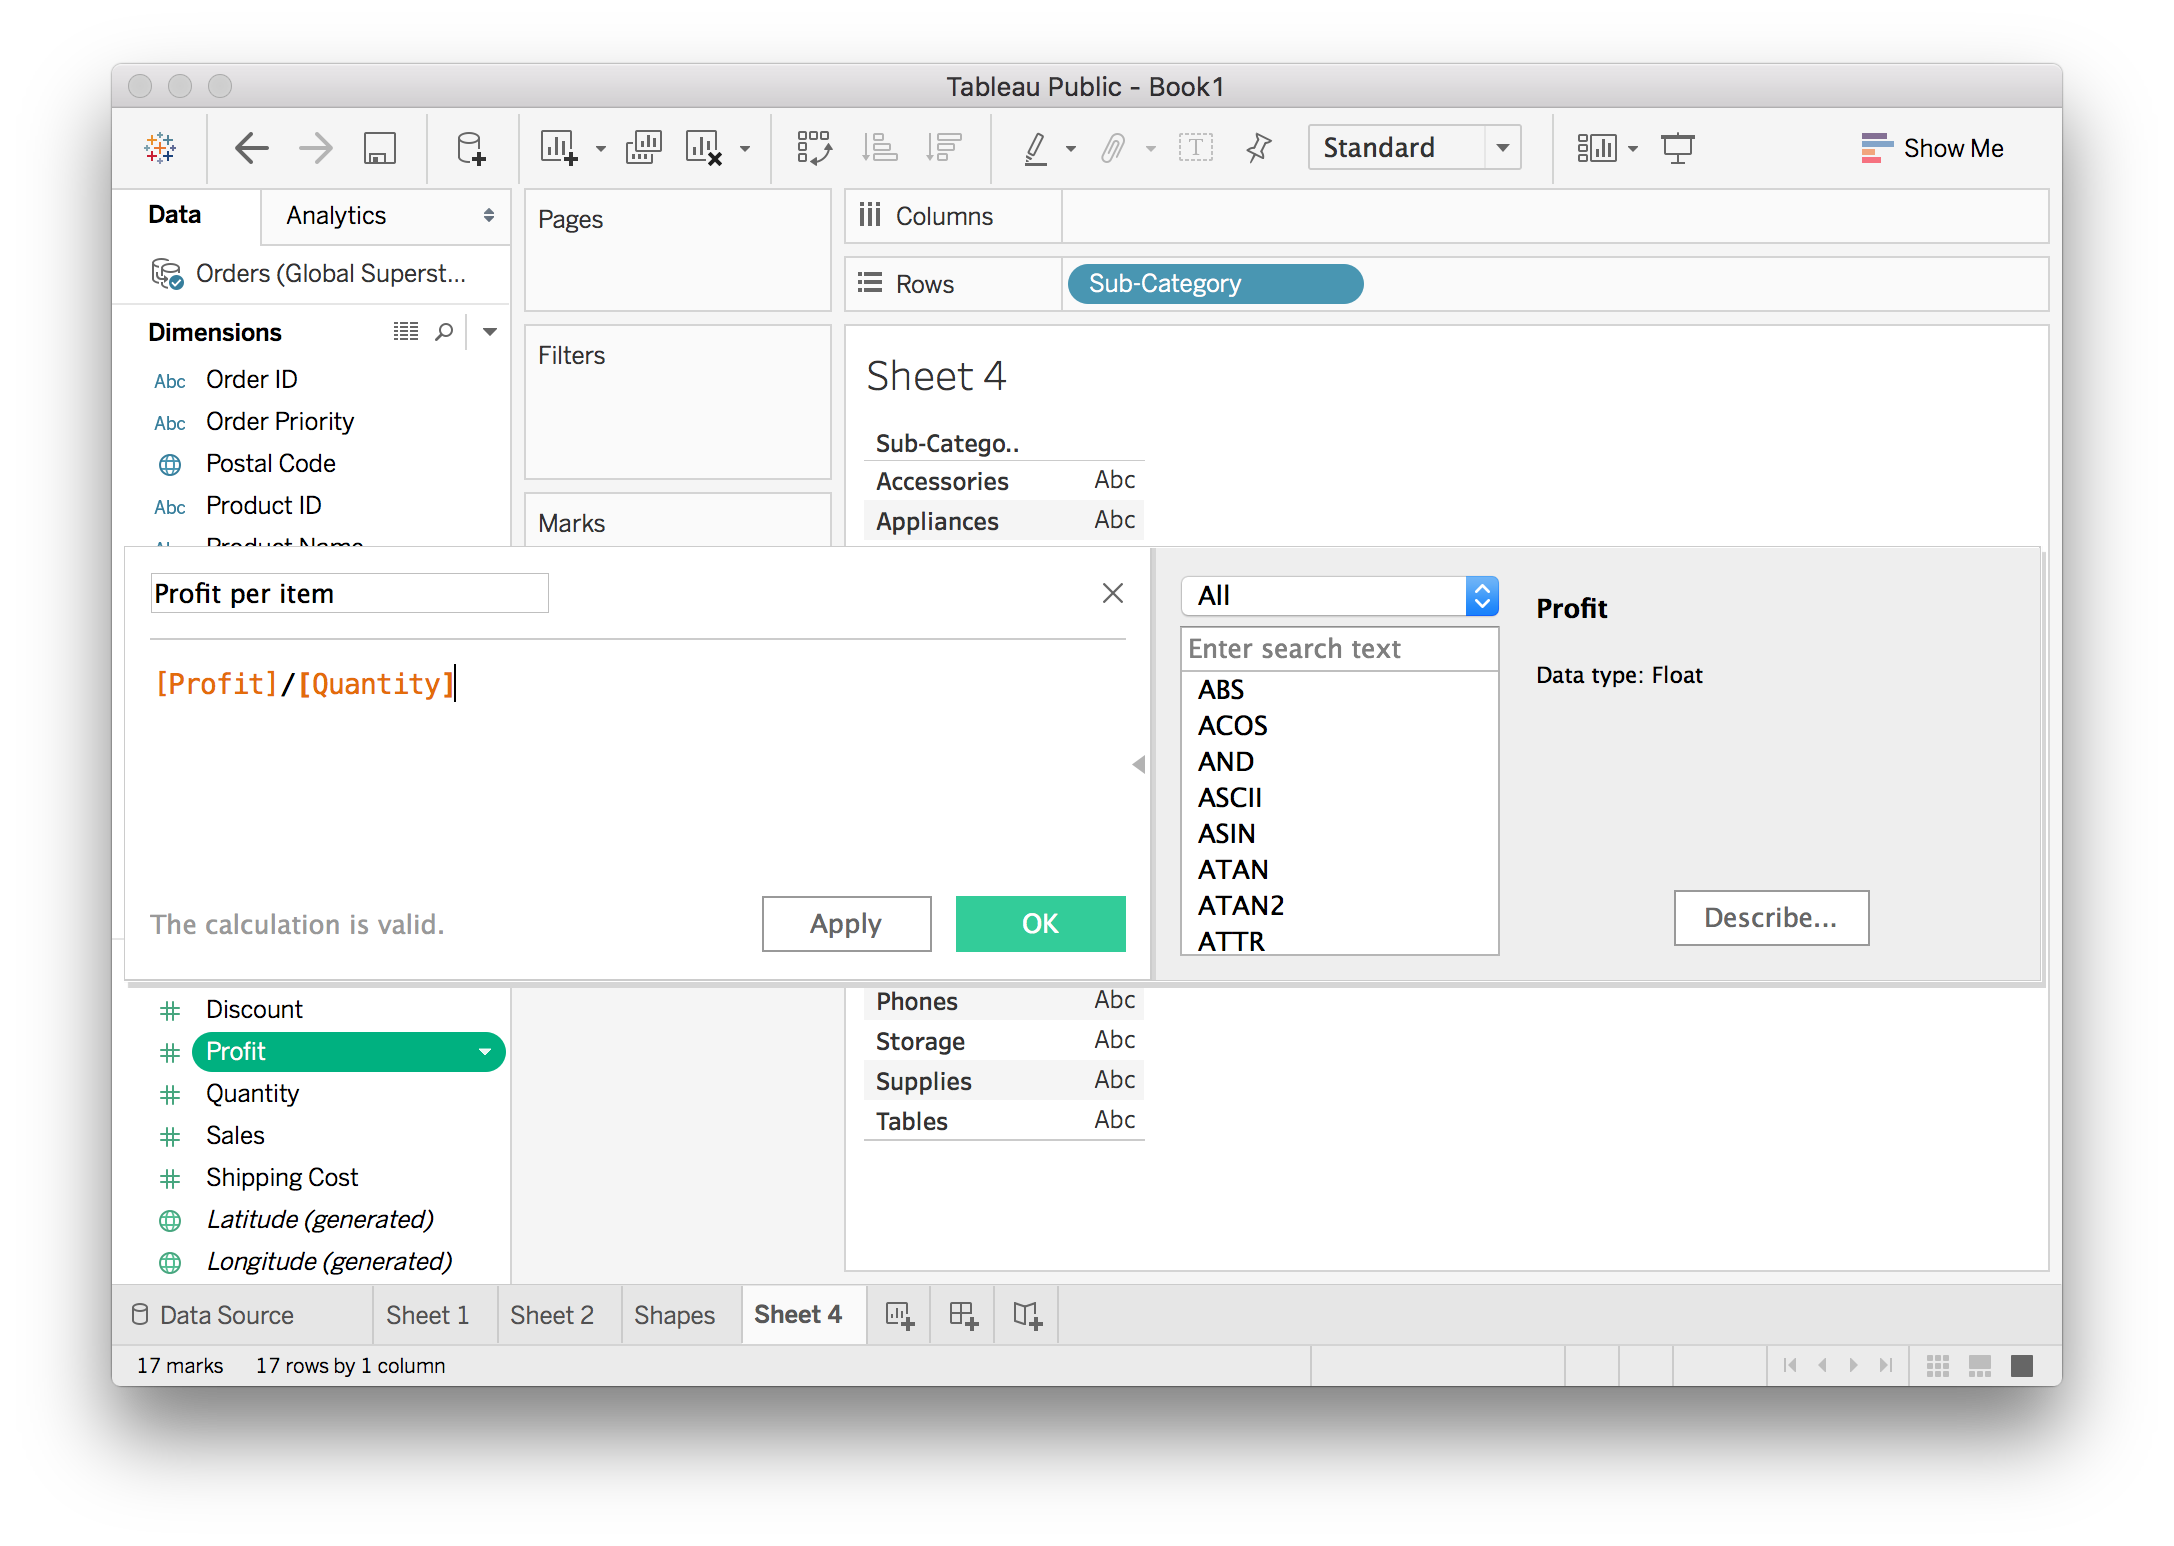
Here we want to create a new field that calculates the profit per item for each record. It's pretty simple, just [Profit]/[Quantity] which I've done below. I also renamed the calculated field to "Profit per item".
Once you hit "OK" and create it, the new field shows up in the data pane. You can use it just like any other field. I made a plot of the average profit per item for each sub-category.
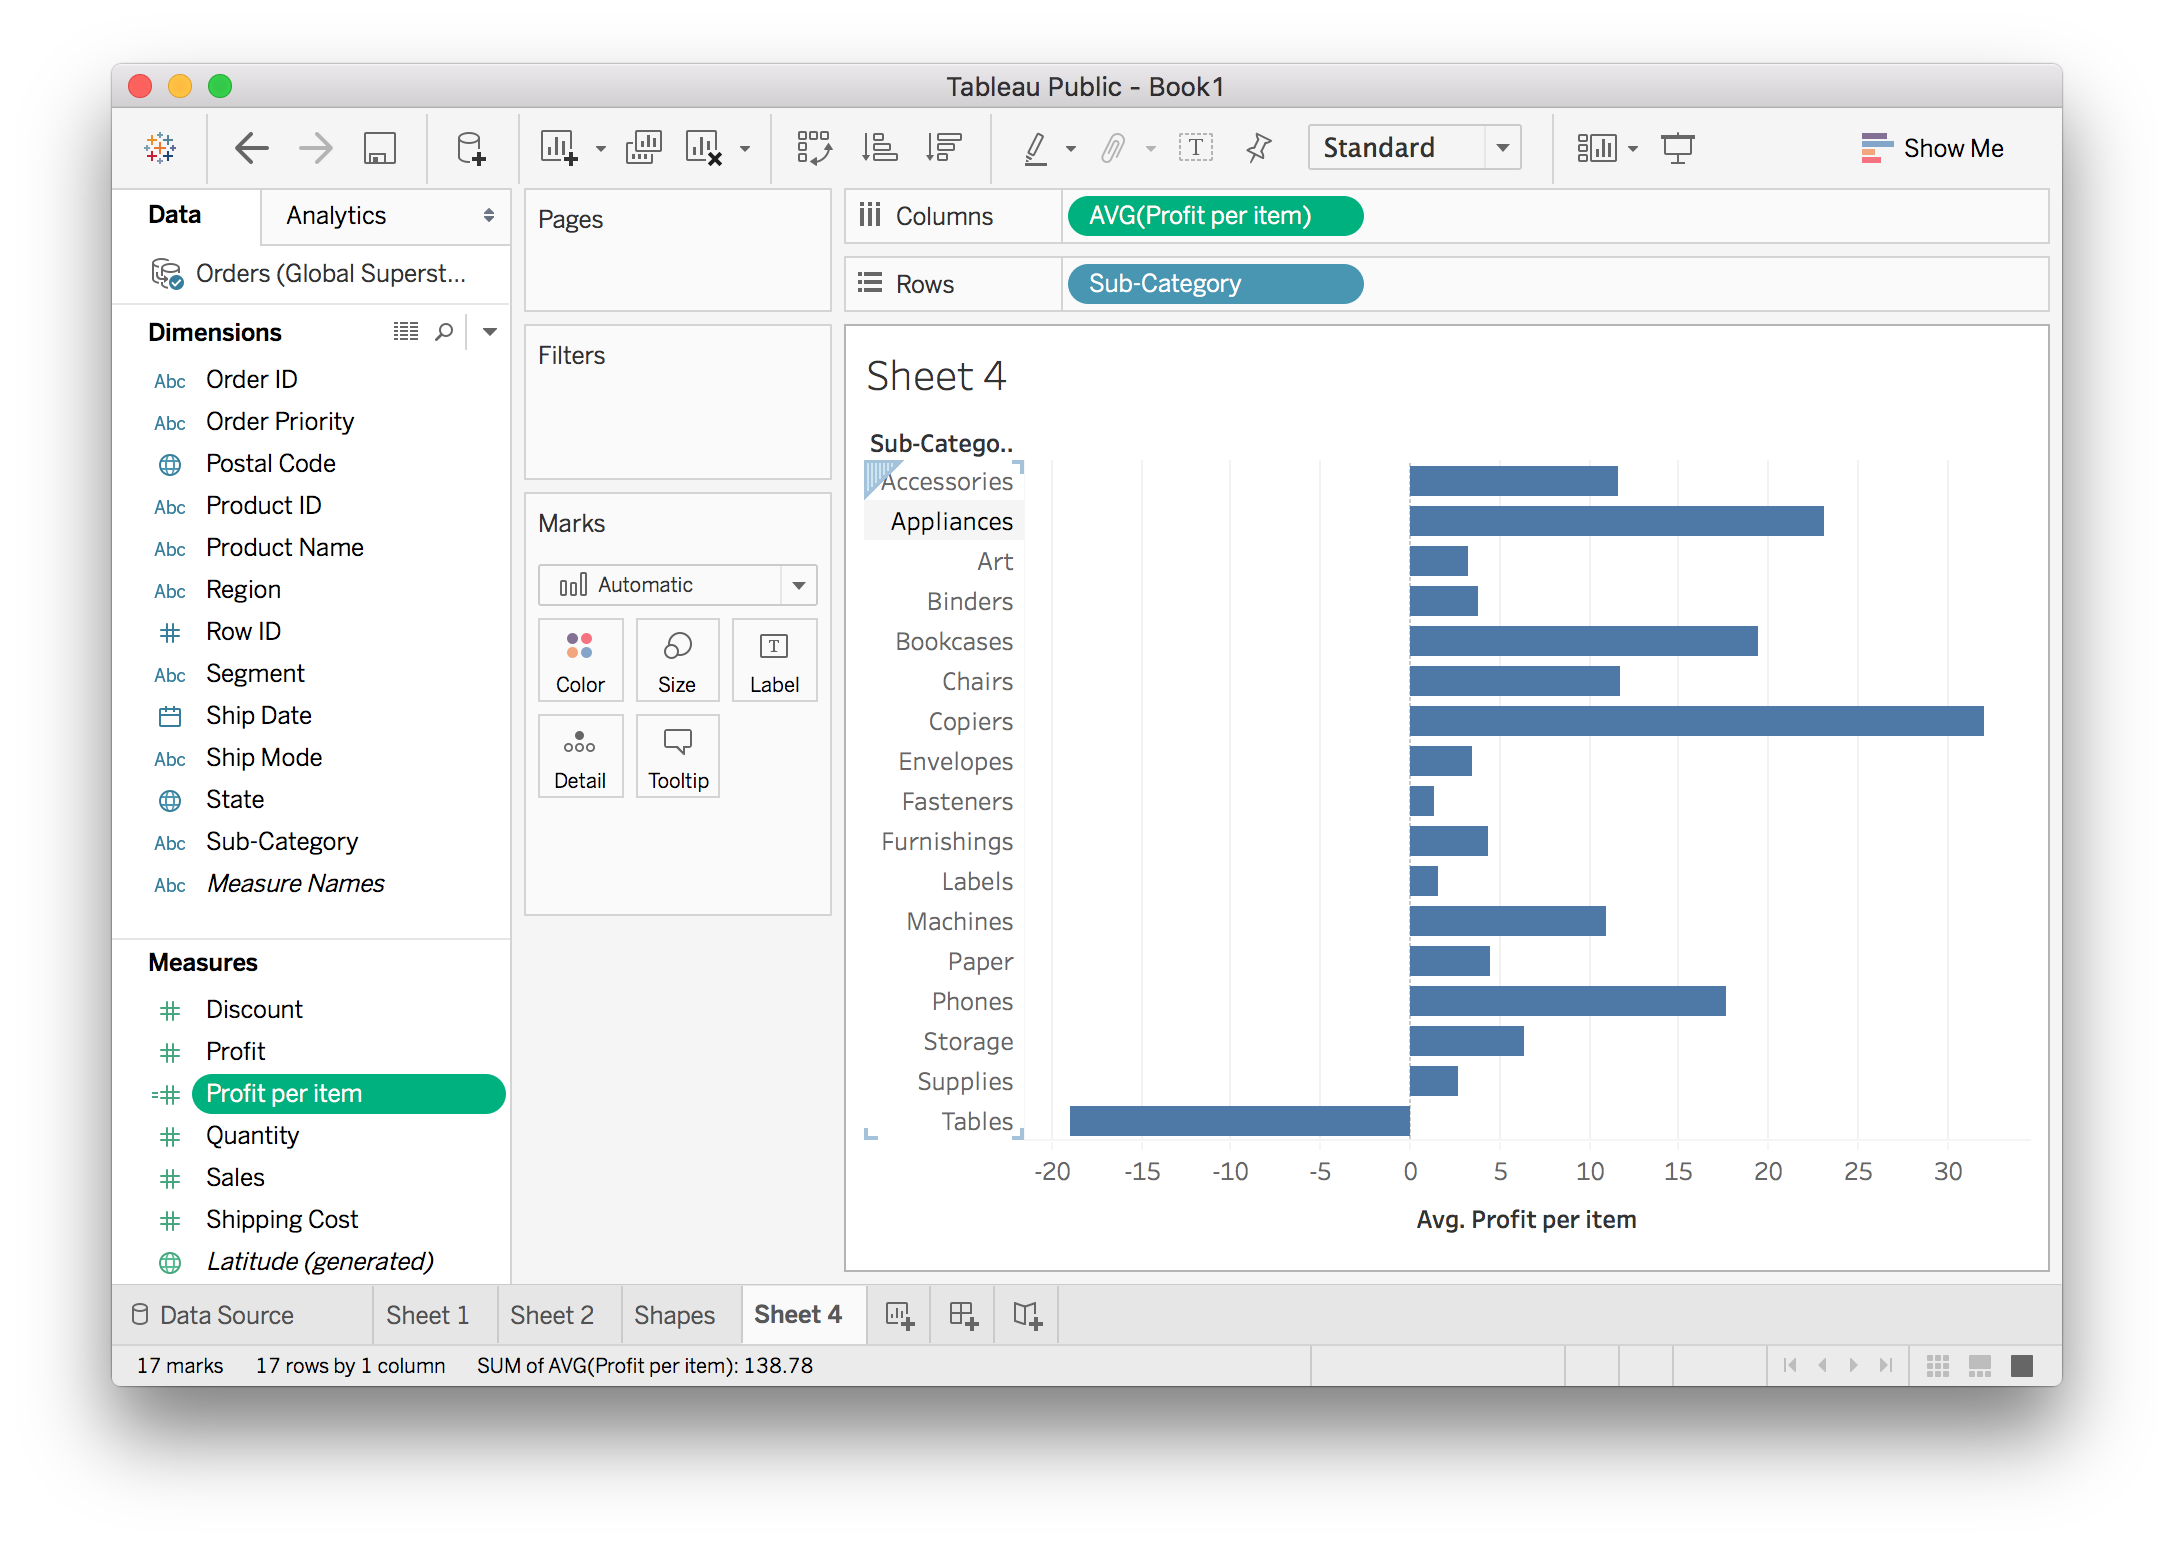
You can see the Profit per item field on the left. The little equals sign =# next to the name means it is a calculated field. Now this field has the profit per item for each record. We want to know the average profit per item for each sub-category, so drag it to Columns and do an average aggregation.
Aggregation in Calculated Fields
You can also do aggregation directly in a calculated field. For instance, we can also calculate the profit per item by SUM([Profit])/SUM([Quantity]). The SUM() functions are aggregations just like you do with fields in views.
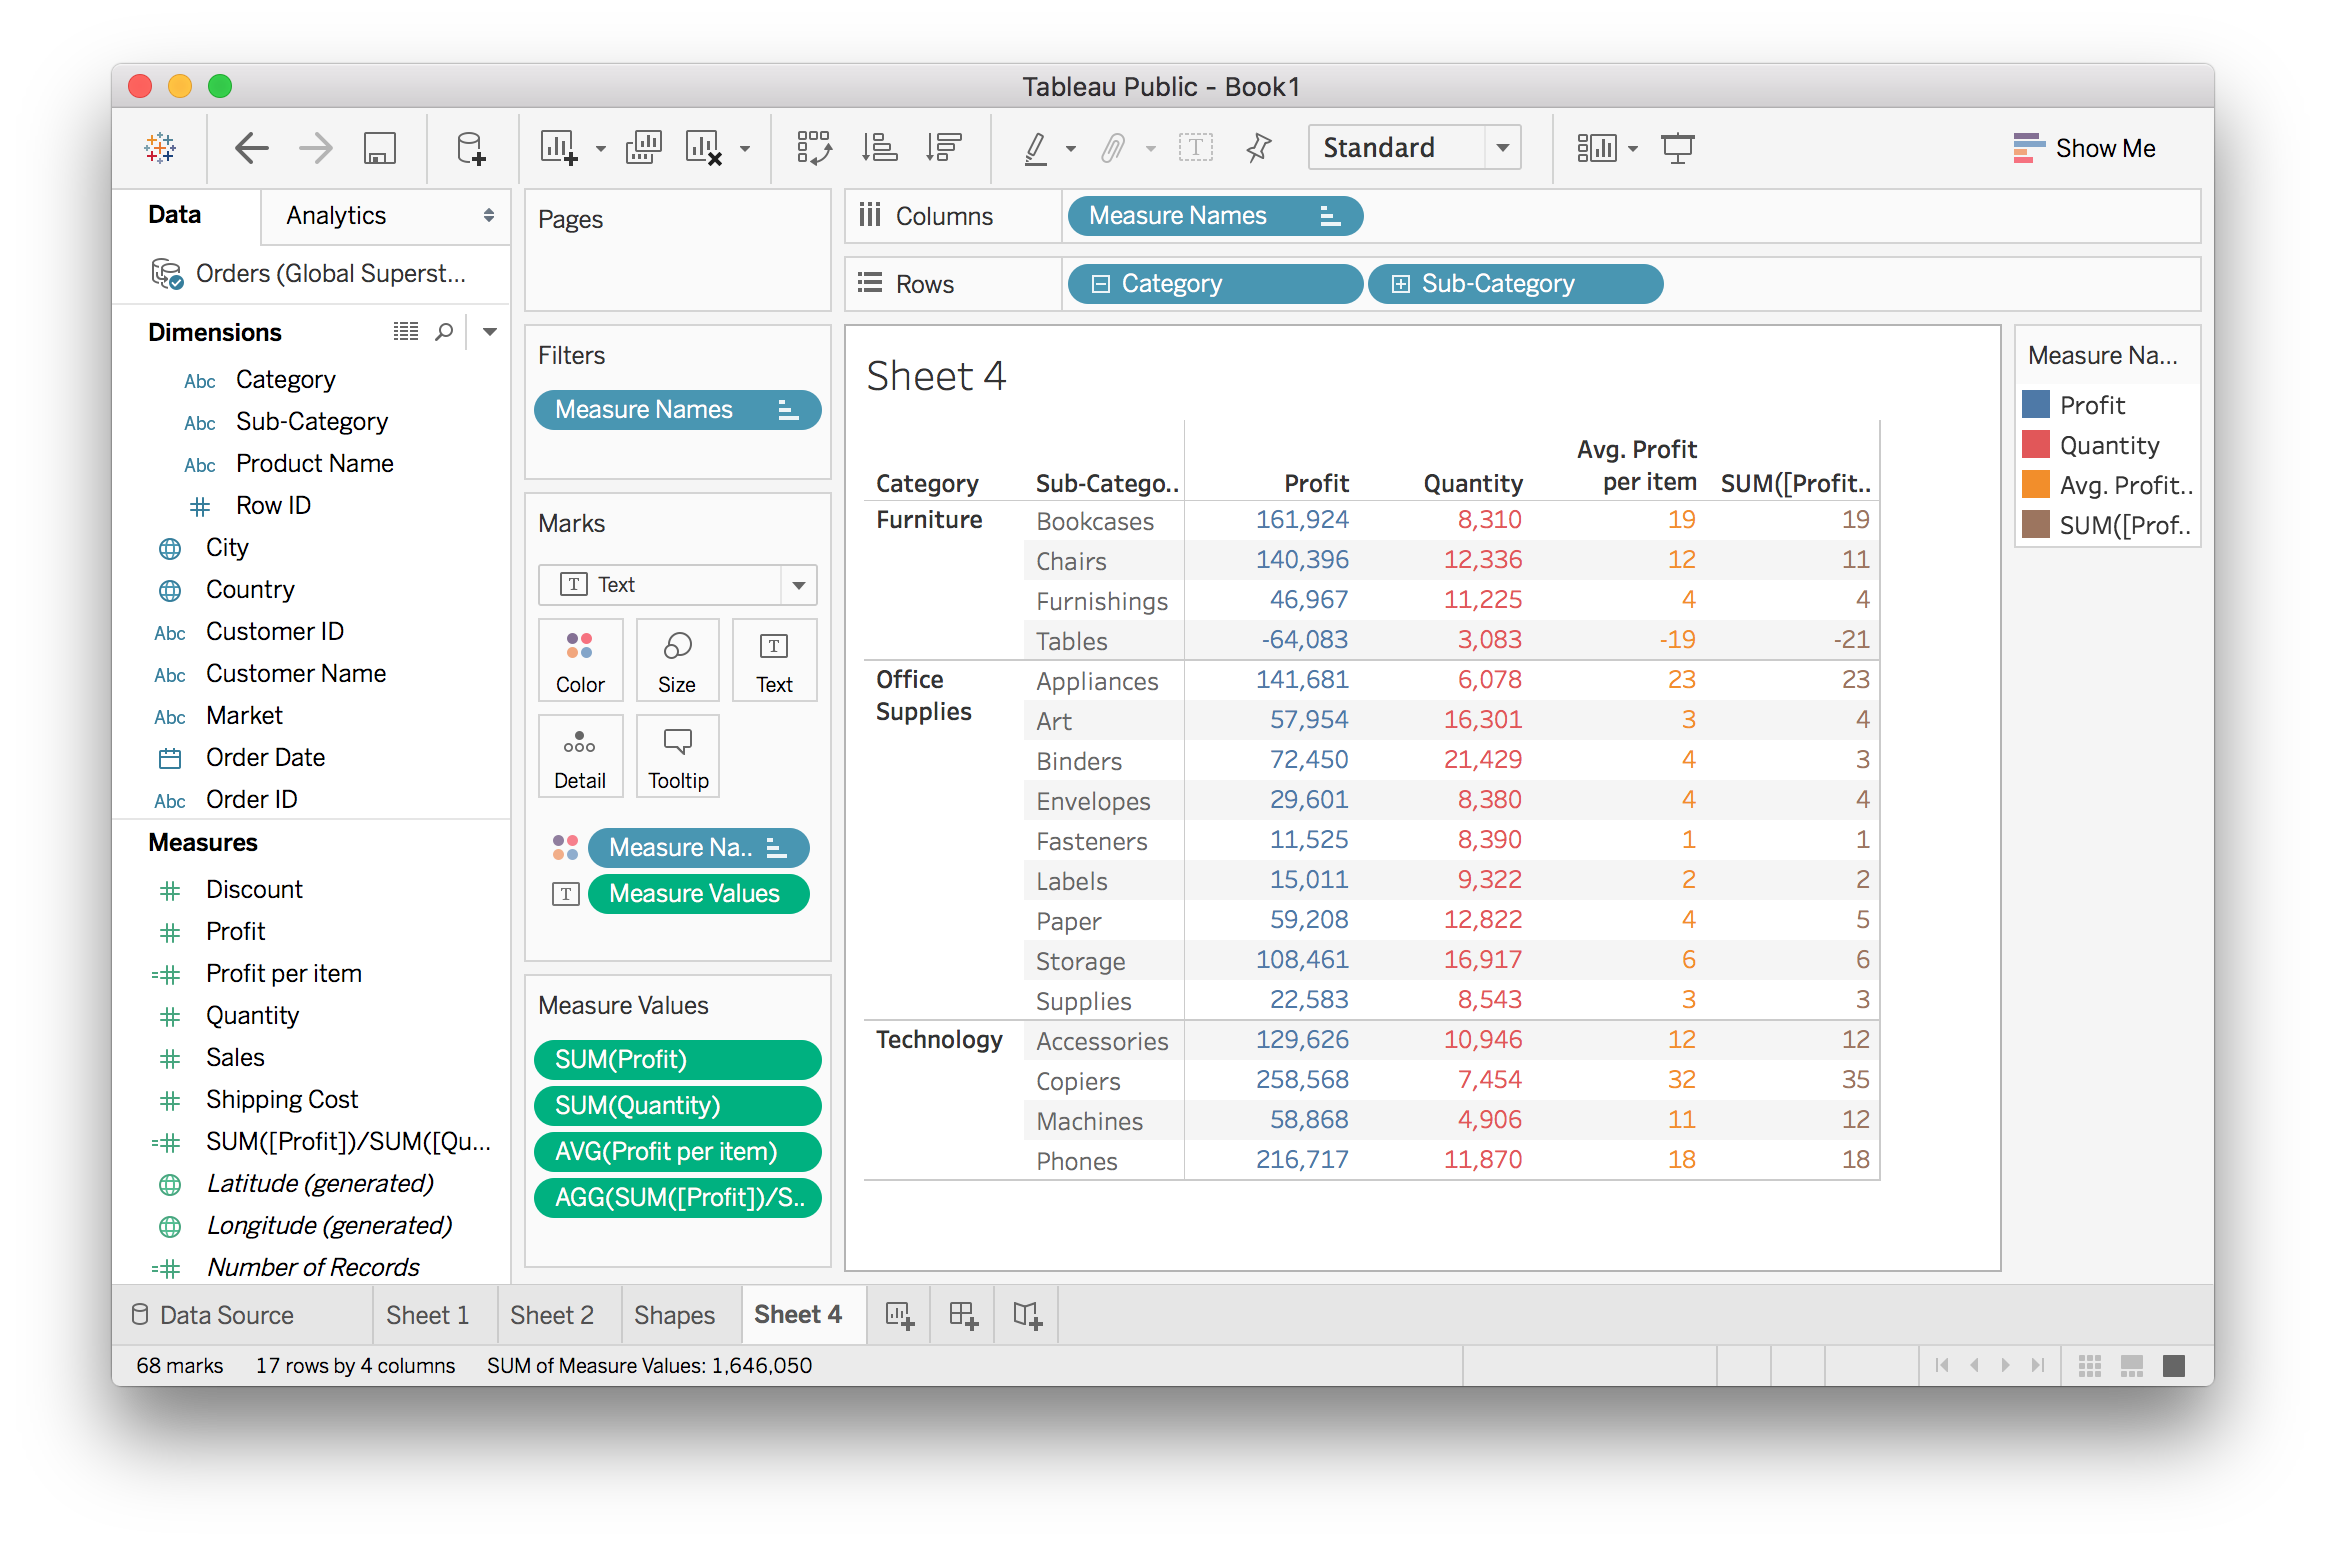
The two methods for calculating the profit per item look basically the same, but there are some discrepancies like in "Tables". I'm going to look at this a little closer so you can see how Tableau works a bit better.
If I expand the table to products…
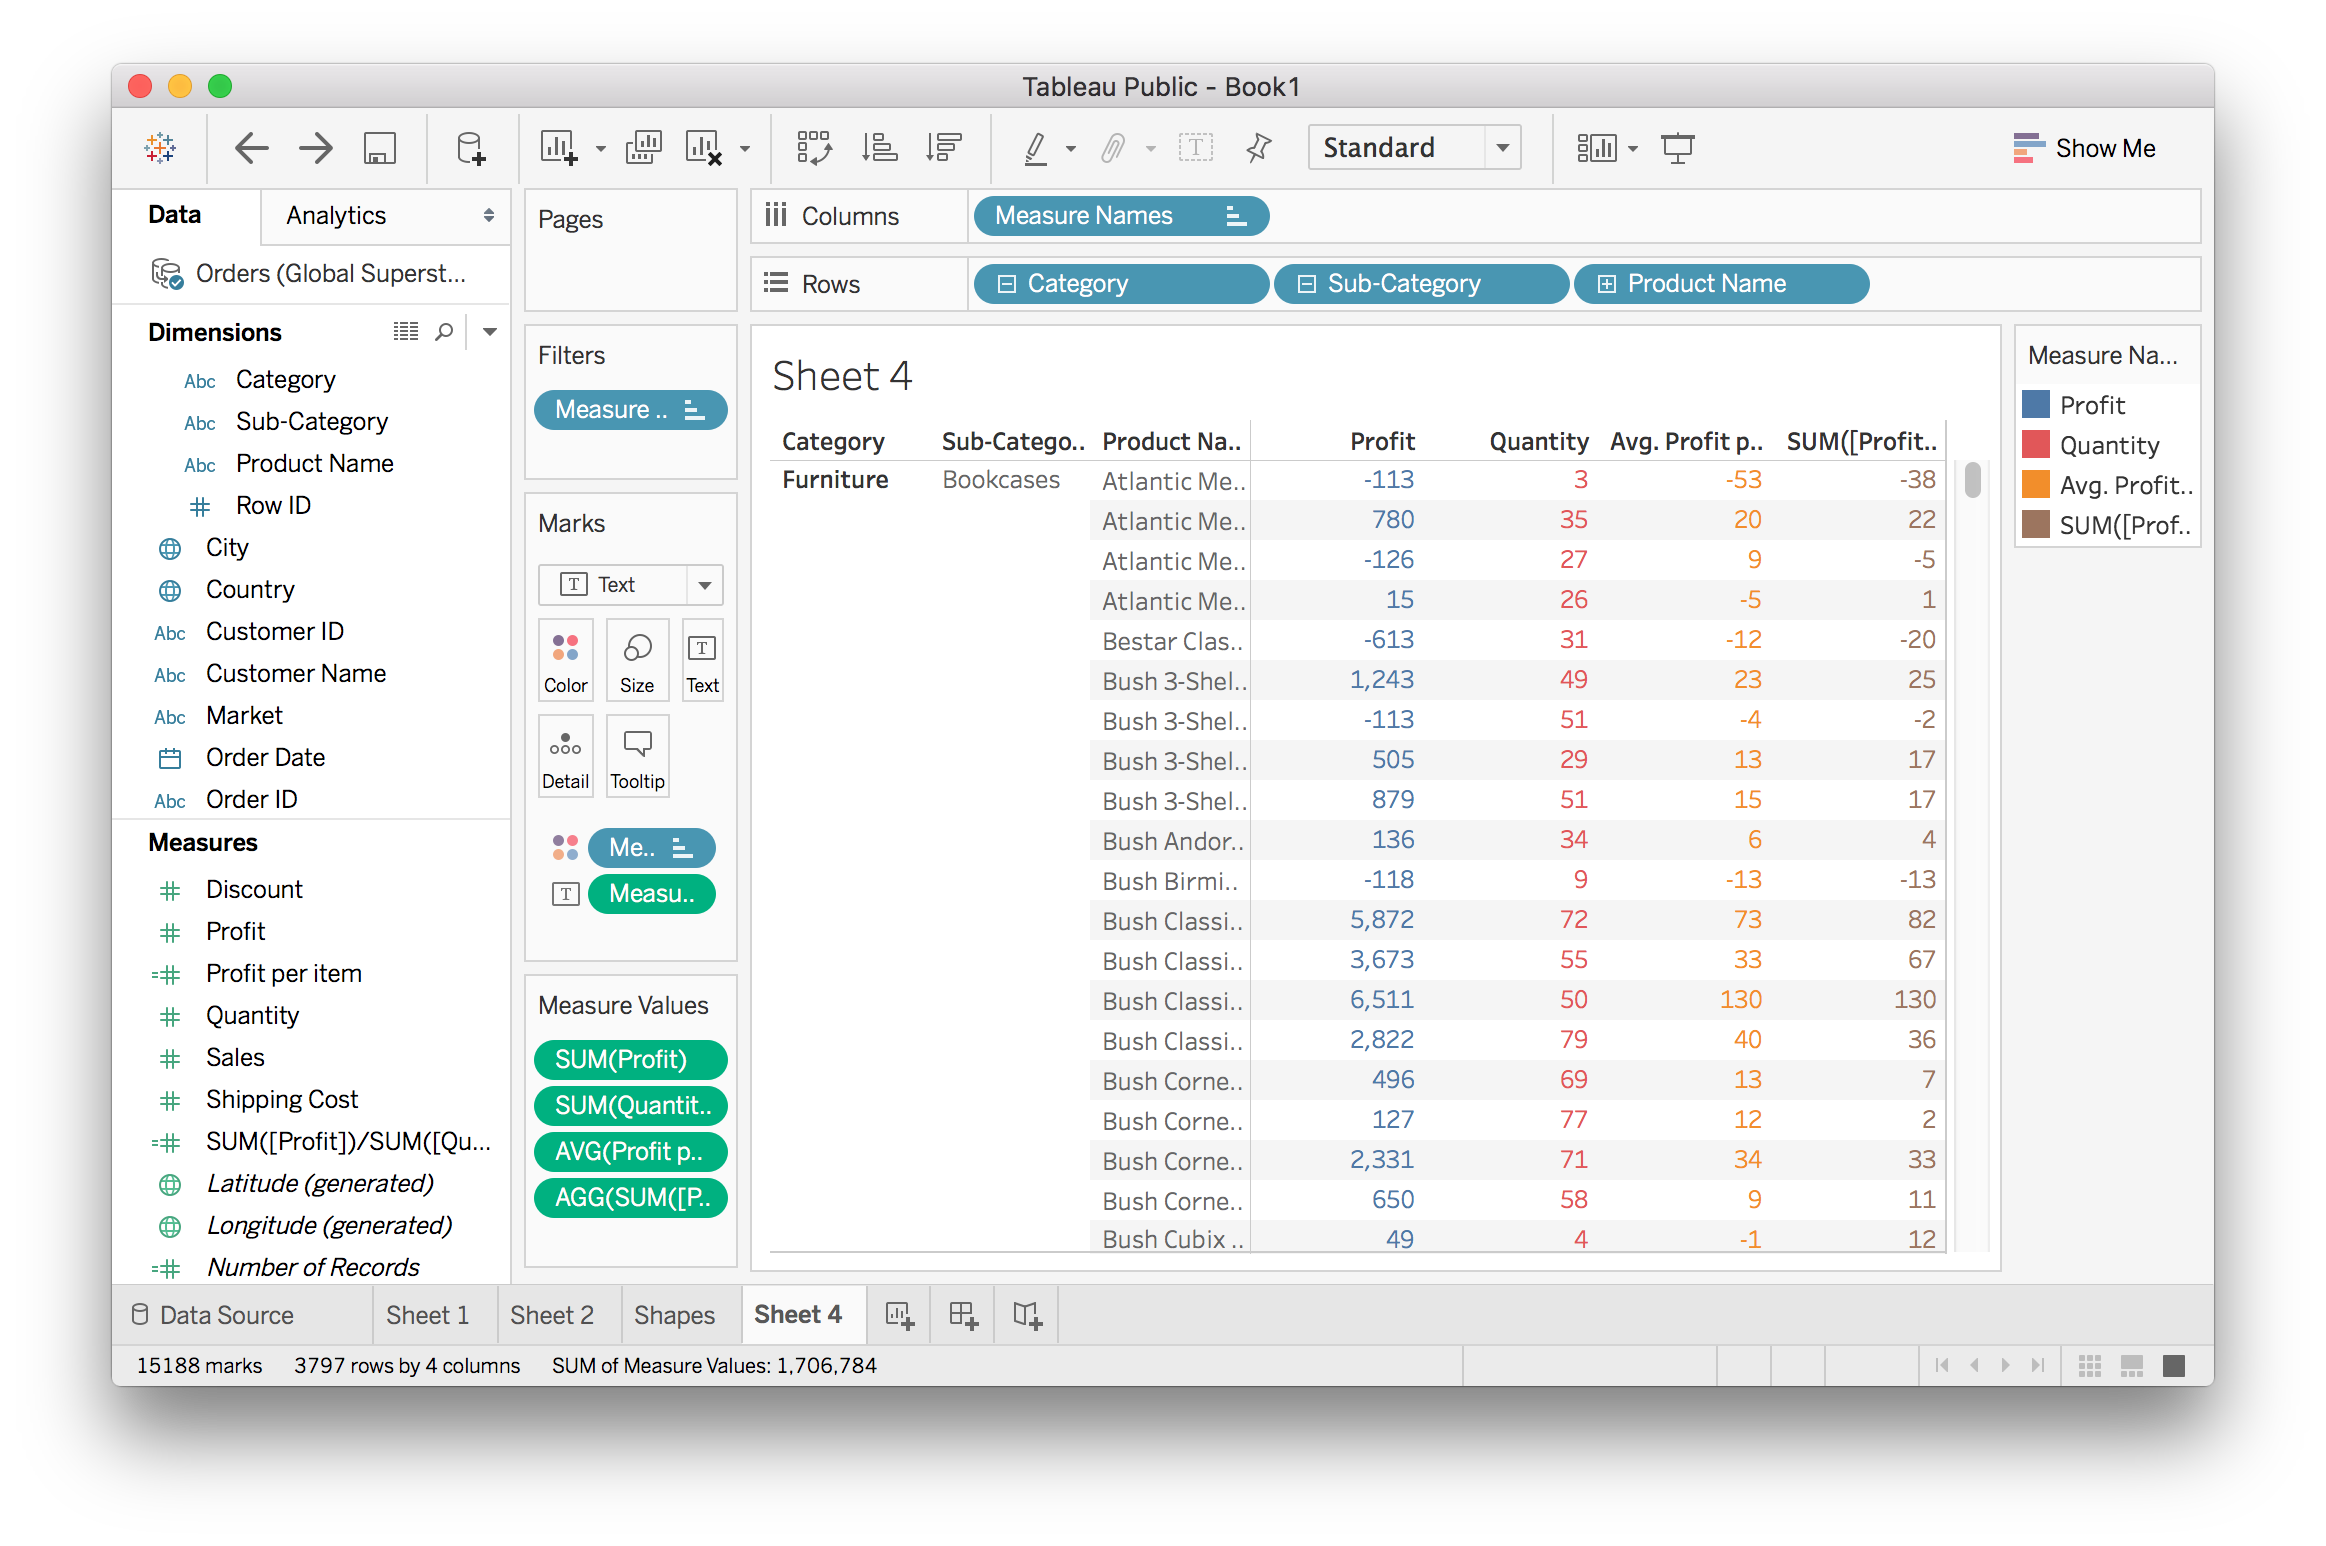
Now we see there are some weird things going on. A lot of the results from the two methods are extremely different. The third product has a profit per item of $9 or -$5. Looking at the values of Profit and Quantity, it appears that the aggregation method (SUM([Profit])/SUM([Quantity]) is doing the right thing. I'll dig down to individual records to see what's happening.
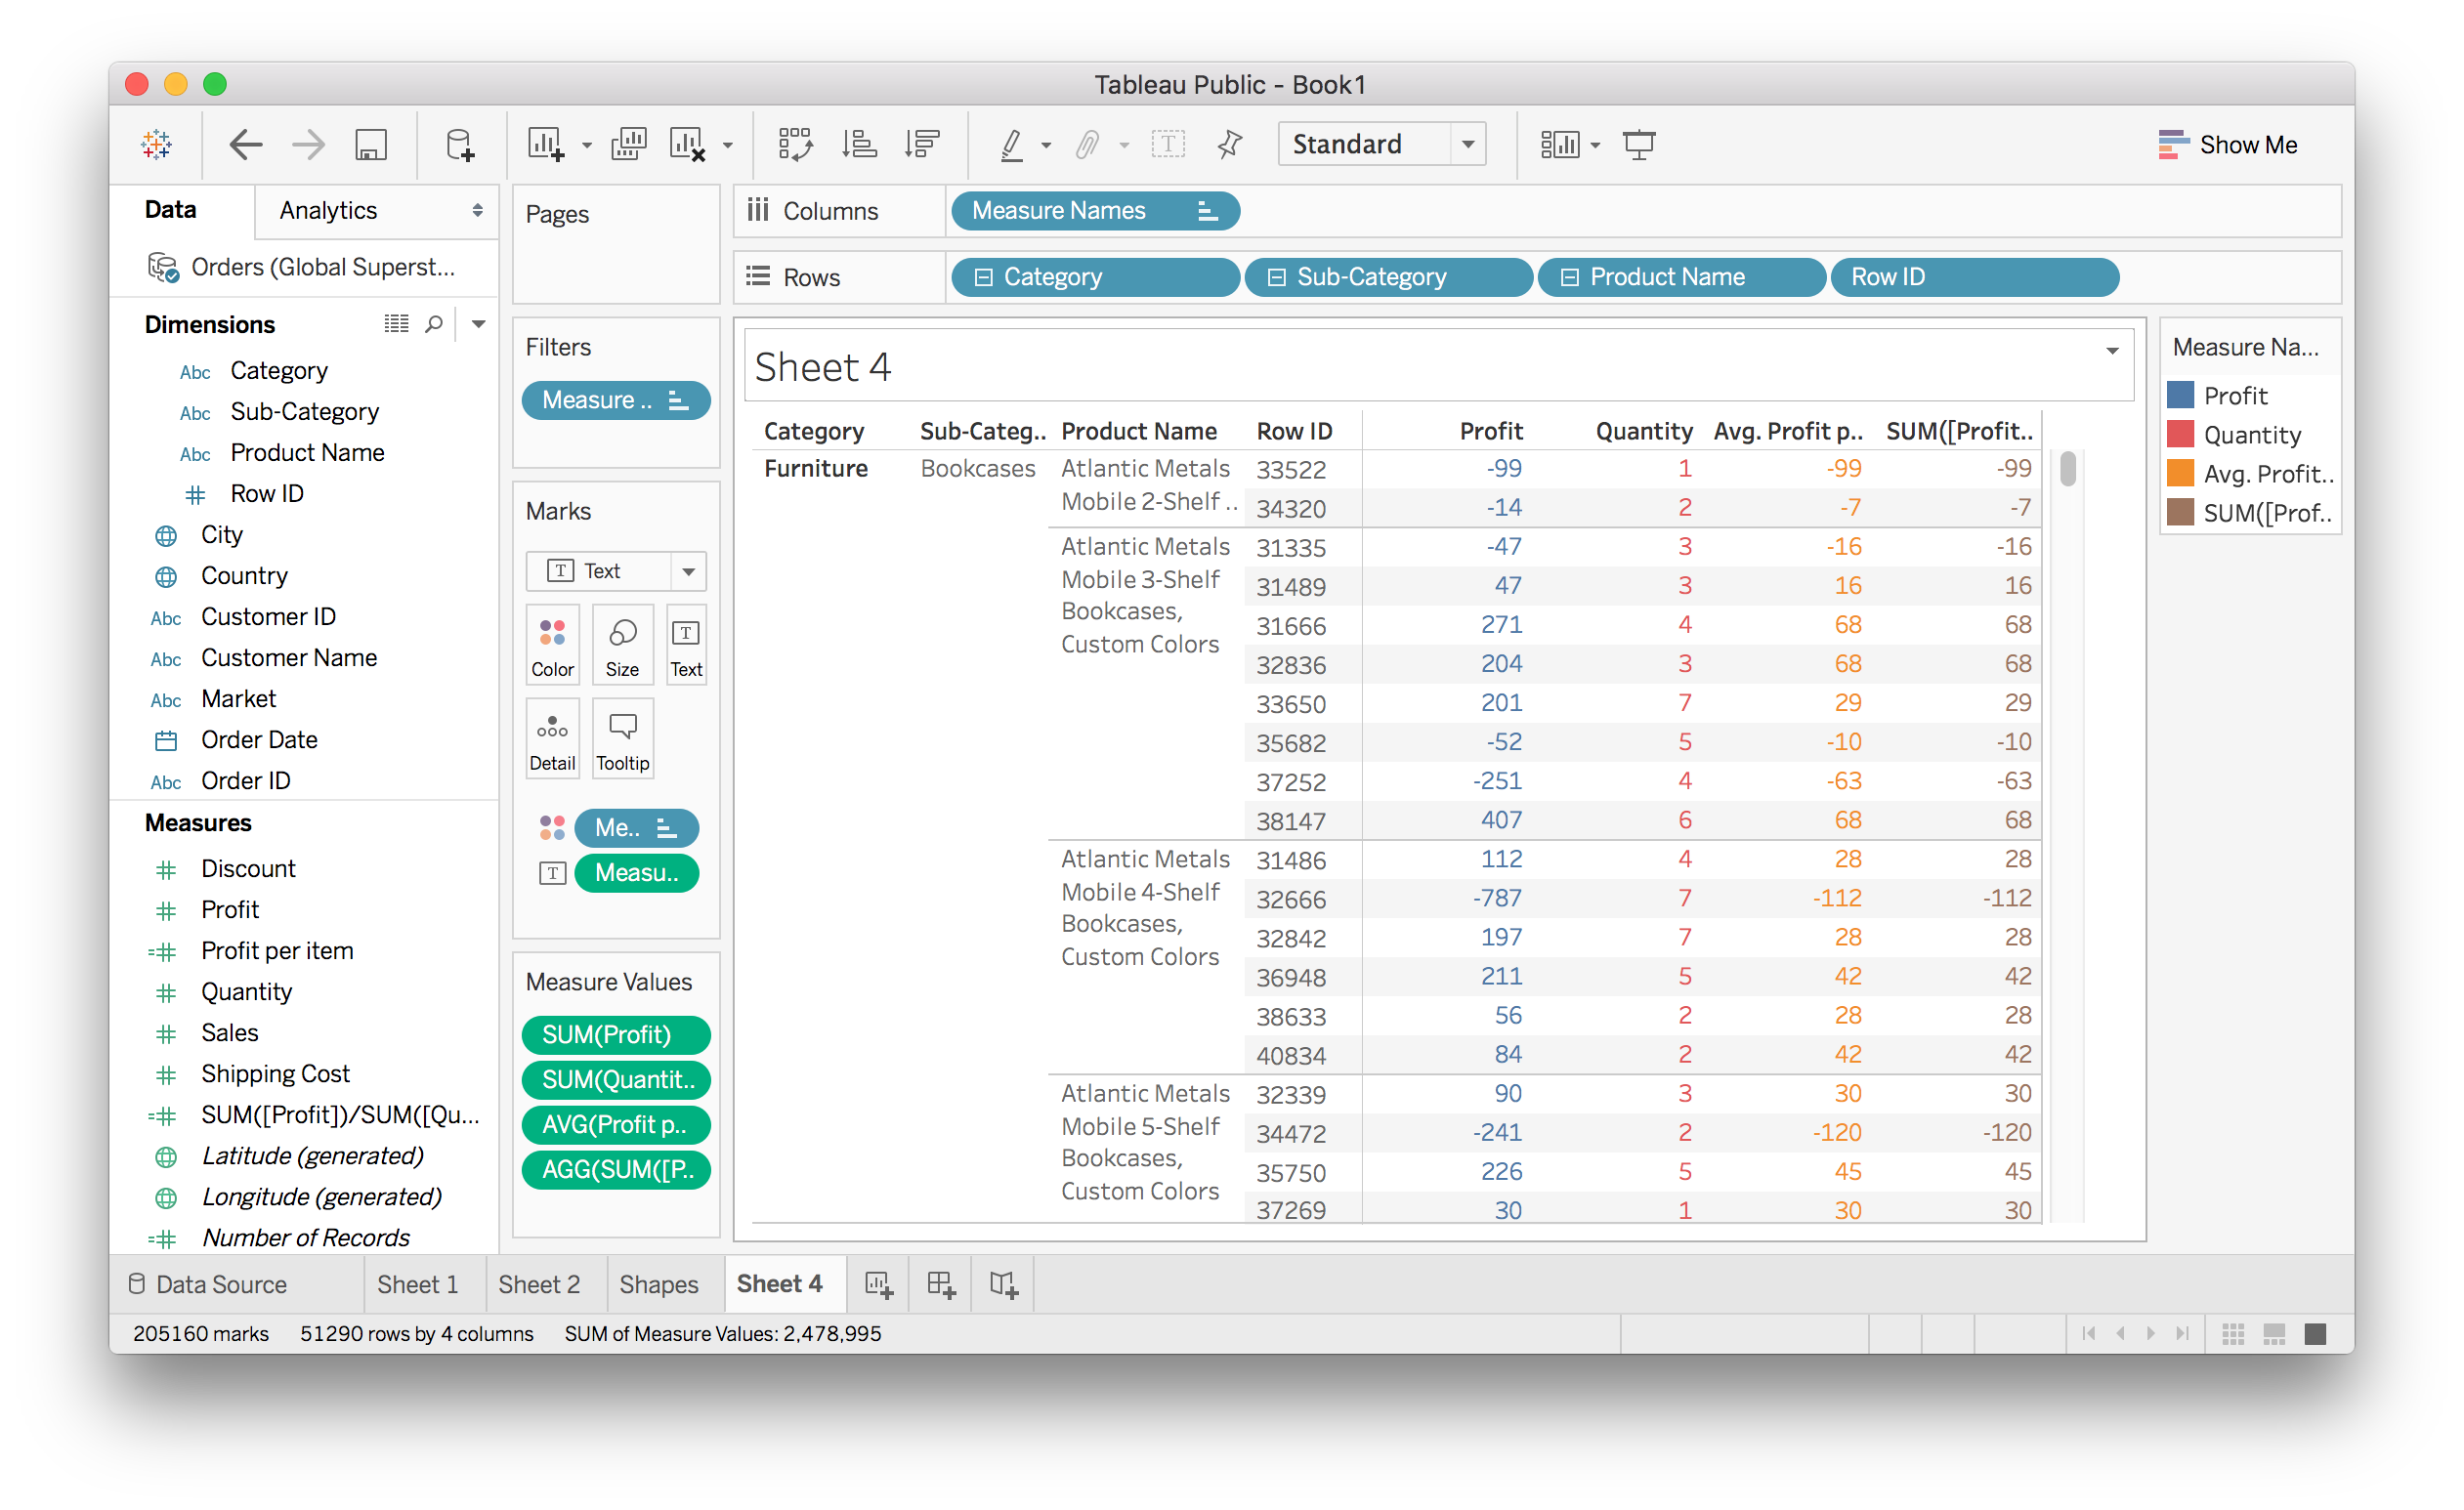
At the row level, the two calculations are the same. It's the averaging of the [Profit]/[Quantity] calculation that is causing the difference. For the the "Atlantic Mobile 4-Shelf Bookcases" product, all the ratios are correct. But when you average them, (28-112+28+42+28+42)/6 = 9.333, you get what we see at the product name level.
The aggregation in the other calculation takes care of that for us. It always calculates the ratios for the level of granularity we're at. You can see the columns Profit and Quantity doing the summation at the level of granularity and the ratio SUM([Profit])/SUM([Quantity]) is taken from those numbers.
The two calculations are answering different questions.
What is the profit ratio for a single order within any product or any other category level?
- Use Average
[Profit]/[Quantity]
- Use Average
What is the profit ratio at any level of a category?
- Use
SUM([Profit])/SUM([Quantity])
- Use
It's important to make sure you are answering the right question when working with data!
Conditional statements
As in Excel and most programming languages, you can use conditional statements like IF, THEN, ELSE in calculations. For example to make a new field to categorize sales as "good" and bad", you could do:
IF SUM([Sales]) > 10000 THEN "Good" ELSE "Bad"
You'll use this pattern a lot, there is a short hand version with the function IIF. The function works like IIF(conditions, if true, if false)
IIF(SUM([Sales]) > 10000, "Good", "Bad")
Calculations with strings
Much of the time you'll find yourself working with strings (text) like the product names in this data set. In calculations, you can do things like split up words in a string, find words in a string, and concatenate strings.
Here's a great tutorial video from Tableau and a blog post with a bunch of in depth examples.
More on calculated fields
There is a lot to learn about calculate fields that's outside the scope of this lesson. If you want to know more about calculated fields, the Tableau documentation is a great place to start. As you're working with Tableau, be sure to visit the documentation often.